Easy way to plot time series in batch.
Usage
geom_ts_batch(
  df,
  xlab = NULL,
  ylab = NULL,
  cclist = NULL,
  bquote = FALSE,
  breaks = waiver(),
  date_breaks = waiver(),
  labels = waiver(),
  date_labels = waiver(),
  minor_breaks = waiver(),
  date_minor_breaks = waiver(),
  expand = c(0, 0),
  panelgap = 1
)
Arguments
- df
dataframe of time series.
- xlab
text expression of x axis label. The default vaule is NULL.
- ylab
text expression of y axis label. The default vaule is NULL.
- cclist
vector, colors of lines. The default vaule is NULL.
- bquote
logical value. Set to TRUE if you want to use bquote in labs (xlab and y lab). The default vaule is FALSE.
- breaks
One of: - `NULL` for no breaks - `waiver()` for the breaks specified by `date_breaks` - A `Date`/`POSIXct` vector giving positions of breaks - A function that takes the limits as input and returns breaks as output
- date_breaks
A string giving the distance between breaks like "2 weeks", or "10 years". If both `breaks` and `date_breaks` are specified, `date_breaks` wins.
- labels
One of: - `NULL` no labels - `waiver()` for the default labels computed by the transformation object - A character vector giving labels (must be same length as `breaks`) - A function that takes the breaks as input and returns labels as output. Also accepts rlang lambda function notation.
- date_labels
A string giving the formatting specification for the labels. Codes are defined in [strftime()]. If both `labels` and `date_labels` are specified, `date_labels` wins.
- minor_breaks
One of: - `NULL` for no breaks - `waiver()` for the breaks specified by `date_minor_breaks` - A `Date`/`POSIXct` vector giving positions of minor breaks - A function that takes the limits as input and returns minor breaks as output
- date_minor_breaks
A string giving the distance between minor breaks like "2 weeks", or "10 years". If both `minor_breaks` and `date_minor_breaks` are specified, `date_minor_breaks` wins.
- expand
For position scales, a vector of range expansion constants used to add some padding around the data to ensure that they are placed some distance away from the axes. Use the convenience function expansion() to generate the values for the expand argument. The defaults are to expand the scale by 5 side for discrete variables.
- panelgap
gap of panels. The default vaule is 0.5.
Examples
#example 1
geom_ts_batch(aqi)
#> Scale for 'y' is already present. Adding another scale for 'y', which will
#> replace the existing scale.
#> Scale for 'x' is already present. Adding another scale for 'x', which will
#> replace the existing scale.
#> Scale for 'x' is already present. Adding another scale for 'x', which will
#> replace the existing scale.
#> Warning: Removed 1678 rows containing missing values (geom_point).
#> Warning: Removed 1530 rows containing missing values (geom_point).
#> Warning: Removed 2081 rows containing missing values (geom_point).
#> Warning: Removed 1829 row(s) containing missing values (geom_path).
#> Warning: Removed 1899 rows containing missing values (geom_point).
#> Warning: Removed 1549 rows containing missing values (geom_point).
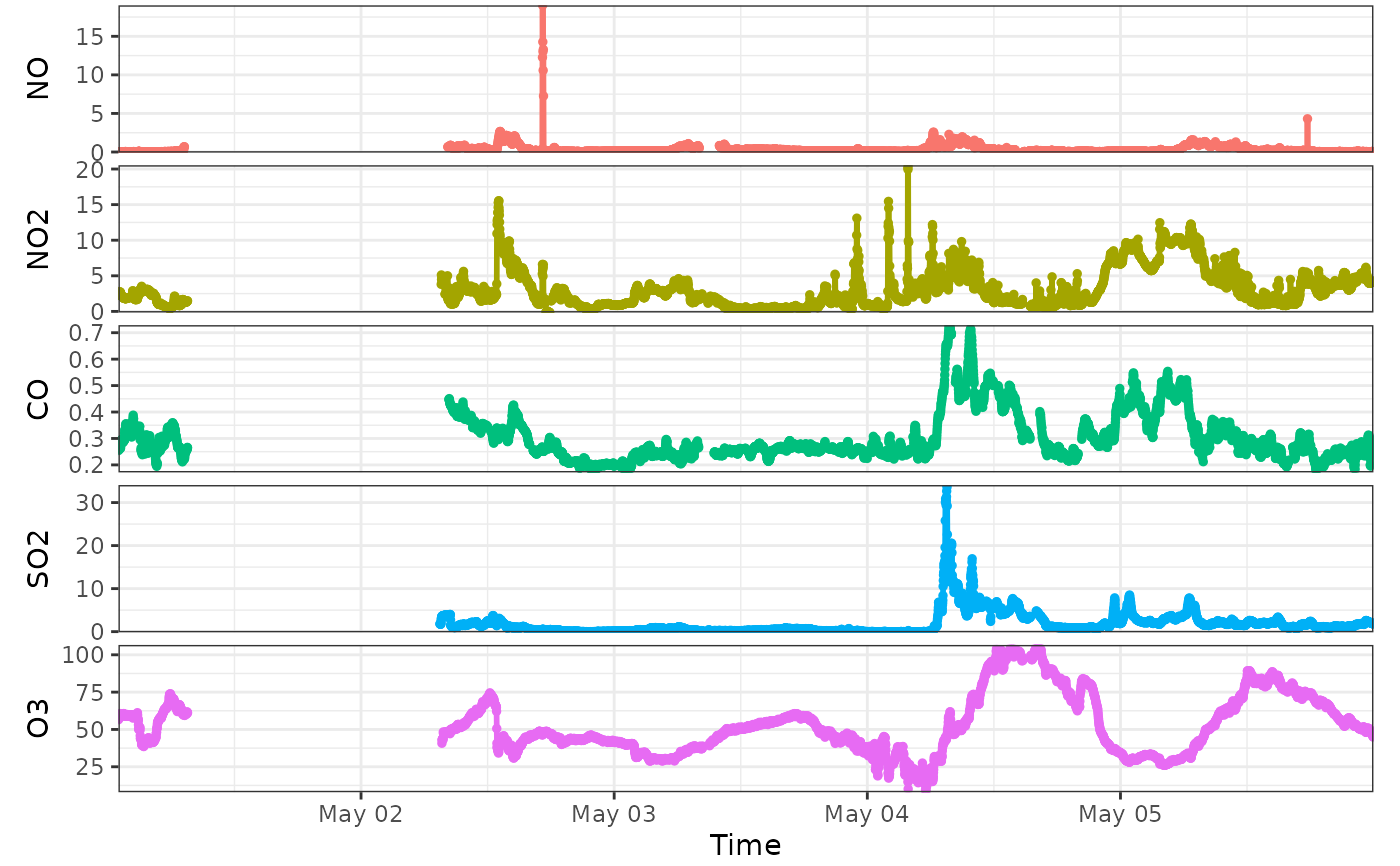 #example 2
xlab1="Time"
ylab1=c("NO","NO2","CO","SO2","O3")
geom_ts_batch(aqi, xlab=xlab1, ylab=ylab1)
#> Scale for 'y' is already present. Adding another scale for 'y', which will
#> replace the existing scale.
#> Scale for 'x' is already present. Adding another scale for 'x', which will
#> replace the existing scale.
#> Scale for 'x' is already present. Adding another scale for 'x', which will
#> replace the existing scale.
#> Warning: Removed 1678 rows containing missing values (geom_point).
#> Warning: Removed 1530 rows containing missing values (geom_point).
#> Warning: Removed 2081 rows containing missing values (geom_point).
#> Warning: Removed 1829 row(s) containing missing values (geom_path).
#> Warning: Removed 1899 rows containing missing values (geom_point).
#> Warning: Removed 1549 rows containing missing values (geom_point).
#example 2
xlab1="Time"
ylab1=c("NO","NO2","CO","SO2","O3")
geom_ts_batch(aqi, xlab=xlab1, ylab=ylab1)
#> Scale for 'y' is already present. Adding another scale for 'y', which will
#> replace the existing scale.
#> Scale for 'x' is already present. Adding another scale for 'x', which will
#> replace the existing scale.
#> Scale for 'x' is already present. Adding another scale for 'x', which will
#> replace the existing scale.
#> Scale for 'y' is already present. Adding another scale for 'y', which will
#> replace the existing scale.
#> Scale for 'x' is already present. Adding another scale for 'x', which will
#> replace the existing scale.
#> Scale for 'x' is already present. Adding another scale for 'x', which will
#> replace the existing scale.
#> Scale for 'y' is already present. Adding another scale for 'y', which will
#> replace the existing scale.
#> Scale for 'x' is already present. Adding another scale for 'x', which will
#> replace the existing scale.
#> Scale for 'x' is already present. Adding another scale for 'x', which will
#> replace the existing scale.
#> Scale for 'y' is already present. Adding another scale for 'y', which will
#> replace the existing scale.
#> Scale for 'x' is already present. Adding another scale for 'x', which will
#> replace the existing scale.
#> Scale for 'x' is already present. Adding another scale for 'x', which will
#> replace the existing scale.
#> Scale for 'y' is already present. Adding another scale for 'y', which will
#> replace the existing scale.
#> Scale for 'x' is already present. Adding another scale for 'x', which will
#> replace the existing scale.
#> Scale for 'x' is already present. Adding another scale for 'x', which will
#> replace the existing scale.
#> Warning: Removed 1678 rows containing missing values (geom_point).
#> Warning: Removed 1530 rows containing missing values (geom_point).
#> Warning: Removed 2081 rows containing missing values (geom_point).
#> Warning: Removed 1829 row(s) containing missing values (geom_path).
#> Warning: Removed 1899 rows containing missing values (geom_point).
#> Warning: Removed 1549 rows containing missing values (geom_point).
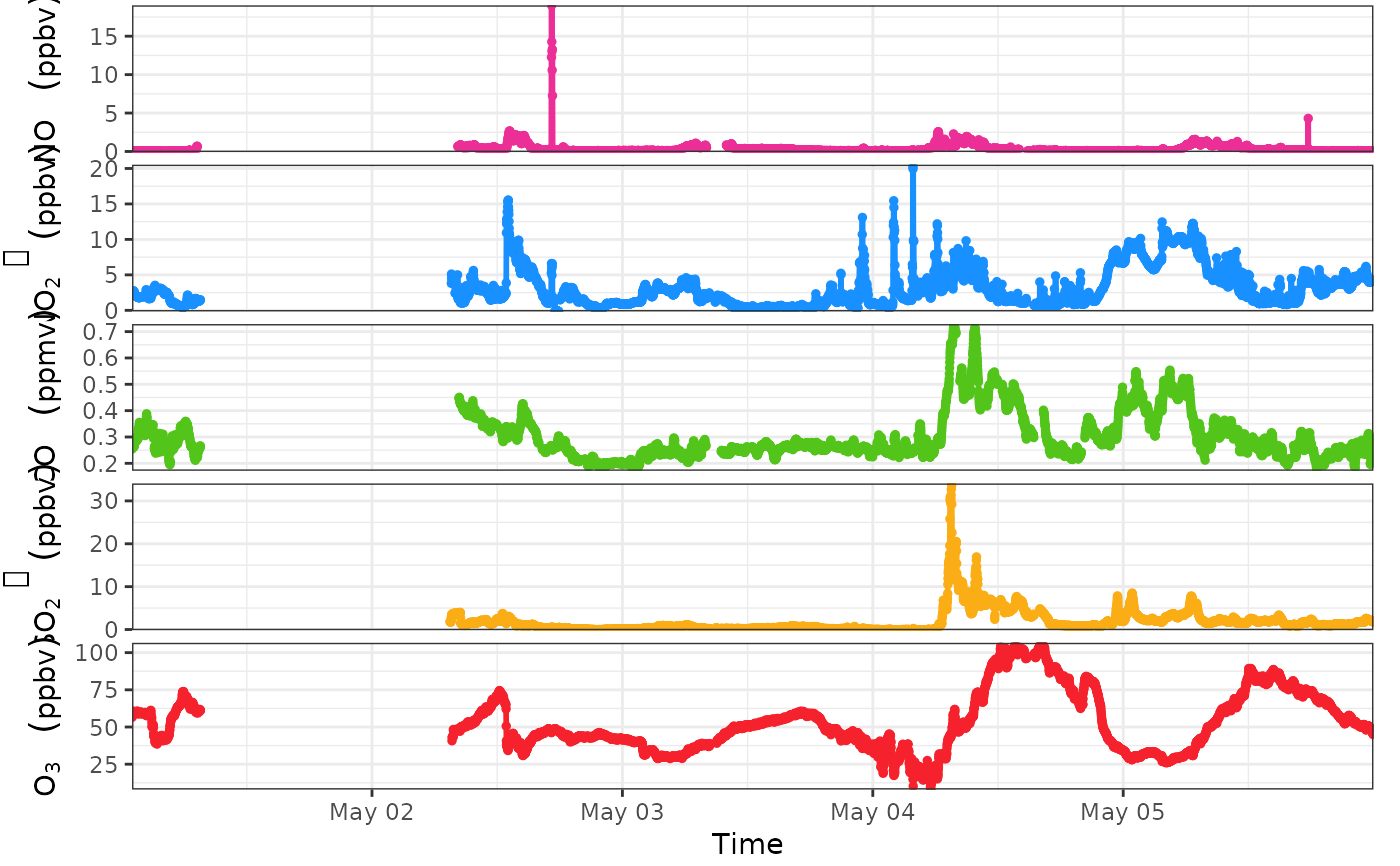
 #example 3
xlab2=bquote(Time~"")
ylab2=list(bquote(NO~" "~(ppbv)), bquote(NO[2]~"
"~(ppbv)), bquote(CO~" "~(ppmv)), bquote(SO[2]~"
"~(ppbv)), bquote(O[3]~" "~(ppbv)))
cclist=c("#eb2f96", "#1890ff", "#52c41a", "#faad14", "#f5222d")
geom_ts_batch(aqi, xlab=xlab2, ylab=ylab2, cclist=cclist, bquote=TRUE)
#> Scale for 'y' is already present. Adding another scale for 'y', which will
#> replace the existing scale.
#> Scale for 'x' is already present. Adding another scale for 'x', which will
#> replace the existing scale.
#> Scale for 'x' is already present. Adding another scale for 'x', which will
#> replace the existing scale.
#> Warning: Removed 1678 rows containing missing values (geom_point).
#> Warning: Removed 1530 rows containing missing values (geom_point).
#> Warning: Removed 2081 rows containing missing values (geom_point).
#> Warning: Removed 1829 row(s) containing missing values (geom_path).
#> Warning: Removed 1899 rows containing missing values (geom_point).
#> Warning: Removed 1549 rows containing missing values (geom_point).
#example 3
xlab2=bquote(Time~"")
ylab2=list(bquote(NO~" "~(ppbv)), bquote(NO[2]~"
"~(ppbv)), bquote(CO~" "~(ppmv)), bquote(SO[2]~"
"~(ppbv)), bquote(O[3]~" "~(ppbv)))
cclist=c("#eb2f96", "#1890ff", "#52c41a", "#faad14", "#f5222d")
geom_ts_batch(aqi, xlab=xlab2, ylab=ylab2, cclist=cclist, bquote=TRUE)
#> Scale for 'y' is already present. Adding another scale for 'y', which will
#> replace the existing scale.
#> Scale for 'x' is already present. Adding another scale for 'x', which will
#> replace the existing scale.
#> Scale for 'x' is already present. Adding another scale for 'x', which will
#> replace the existing scale.
#> Scale for 'y' is already present. Adding another scale for 'y', which will
#> replace the existing scale.
#> Scale for 'x' is already present. Adding another scale for 'x', which will
#> replace the existing scale.
#> Scale for 'x' is already present. Adding another scale for 'x', which will
#> replace the existing scale.
#> Scale for 'y' is already present. Adding another scale for 'y', which will
#> replace the existing scale.
#> Scale for 'x' is already present. Adding another scale for 'x', which will
#> replace the existing scale.
#> Scale for 'x' is already present. Adding another scale for 'x', which will
#> replace the existing scale.
#> Scale for 'y' is already present. Adding another scale for 'y', which will
#> replace the existing scale.
#> Scale for 'x' is already present. Adding another scale for 'x', which will
#> replace the existing scale.
#> Scale for 'x' is already present. Adding another scale for 'x', which will
#> replace the existing scale.
#> Scale for 'y' is already present. Adding another scale for 'y', which will
#> replace the existing scale.
#> Scale for 'x' is already present. Adding another scale for 'x', which will
#> replace the existing scale.
#> Scale for 'x' is already present. Adding another scale for 'x', which will
#> replace the existing scale.
#> Warning: Removed 1678 rows containing missing values (geom_point).
#> Warning: Removed 1530 rows containing missing values (geom_point).
#> Warning: Removed 2081 rows containing missing values (geom_point).
#> Warning: Removed 1829 row(s) containing missing values (geom_path).
#> Warning: Removed 1899 rows containing missing values (geom_point).
#> Warning: Removed 1549 rows containing missing values (geom_point).