Easy way to plot the average variation in batch.
Usage
geom_avri_batch(
  df,
  ssd = 1,
  alpha = 0.5,
  xlab = NULL,
  ylab = NULL,
  lcc = NULL,
  lsize = 1,
  rff = NULL,
  ncol = 2,
  bquote = FALSE
)
Arguments
- df
dataframe contains average variation value and their standard deviation.
- ssd
scale value for standard deviation. The default vaule is 1.
- alpha
the alpha value of ribbon. The default vaule is 0.5.
- xlab
text expression of x axis label. The default vaule is NULL. Need to set with ylab at the same time.
- ylab
text expression of y axis label. The default vaule is NULL. Need to set with xlab at the same time.
- lcc
colors of lines. The default vaule is NULL. Need to set with rff at the same time.
- lsize
size of lines. The default vaule is NULL.The default vaule is 1.
- rff
fill colors of ribbons. The default vaule is NULL. Need to set with lcc at the same time.
- ncol
number of figure columns in final plot layout. The default vaule is 2.
- bquote
logical value. Set to TRUE if you want to use bquote in labs (xlab and y lab). The default vaule is FALSE.
Examples
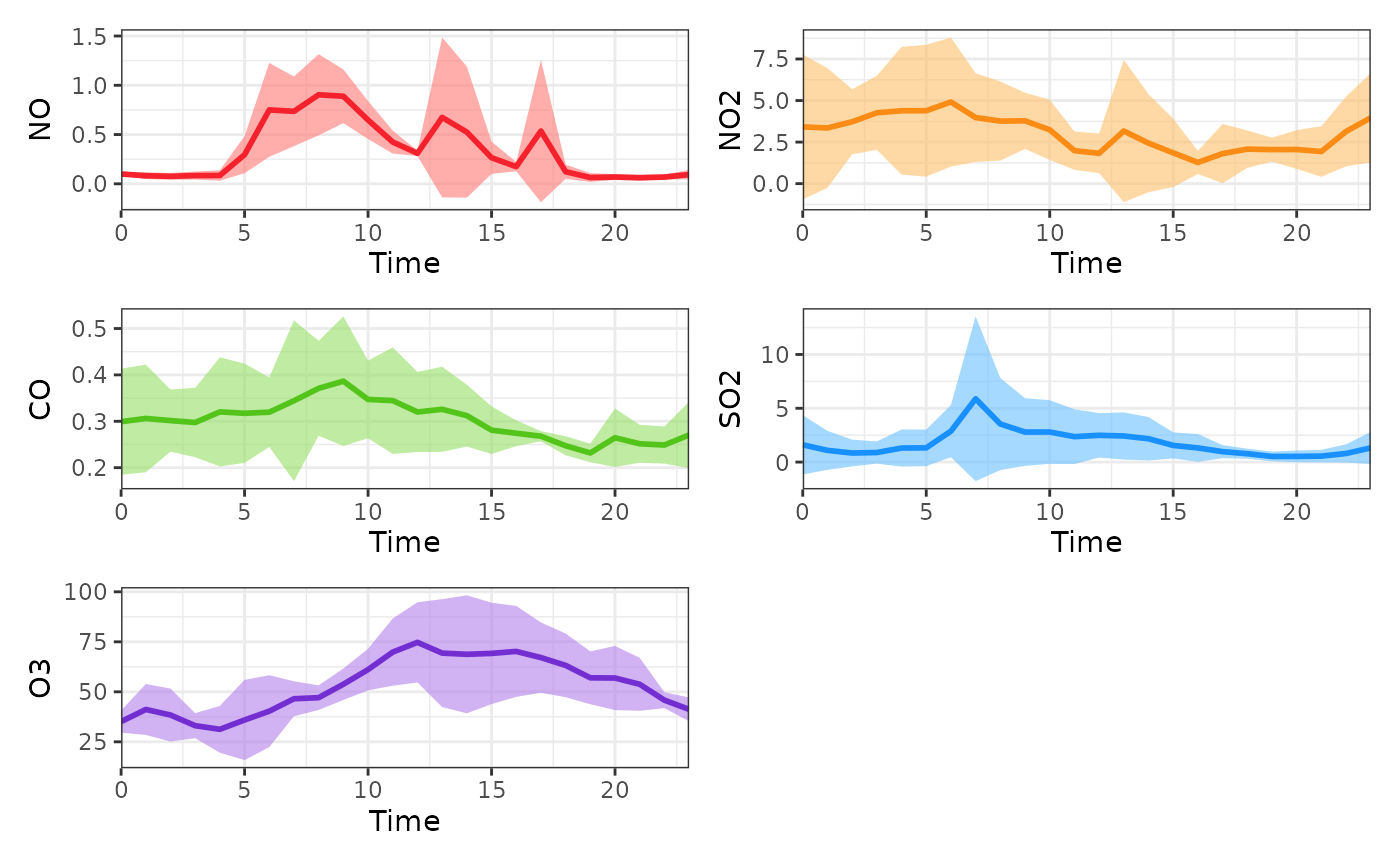
#example 1
x=avri(aqi, bkip = "1 hour", mode = "recipes", value
= "day", st = "2017-05-01 00:00:00")
#> Joining, by = "temp_datetime"
geom_avri_batch(x)
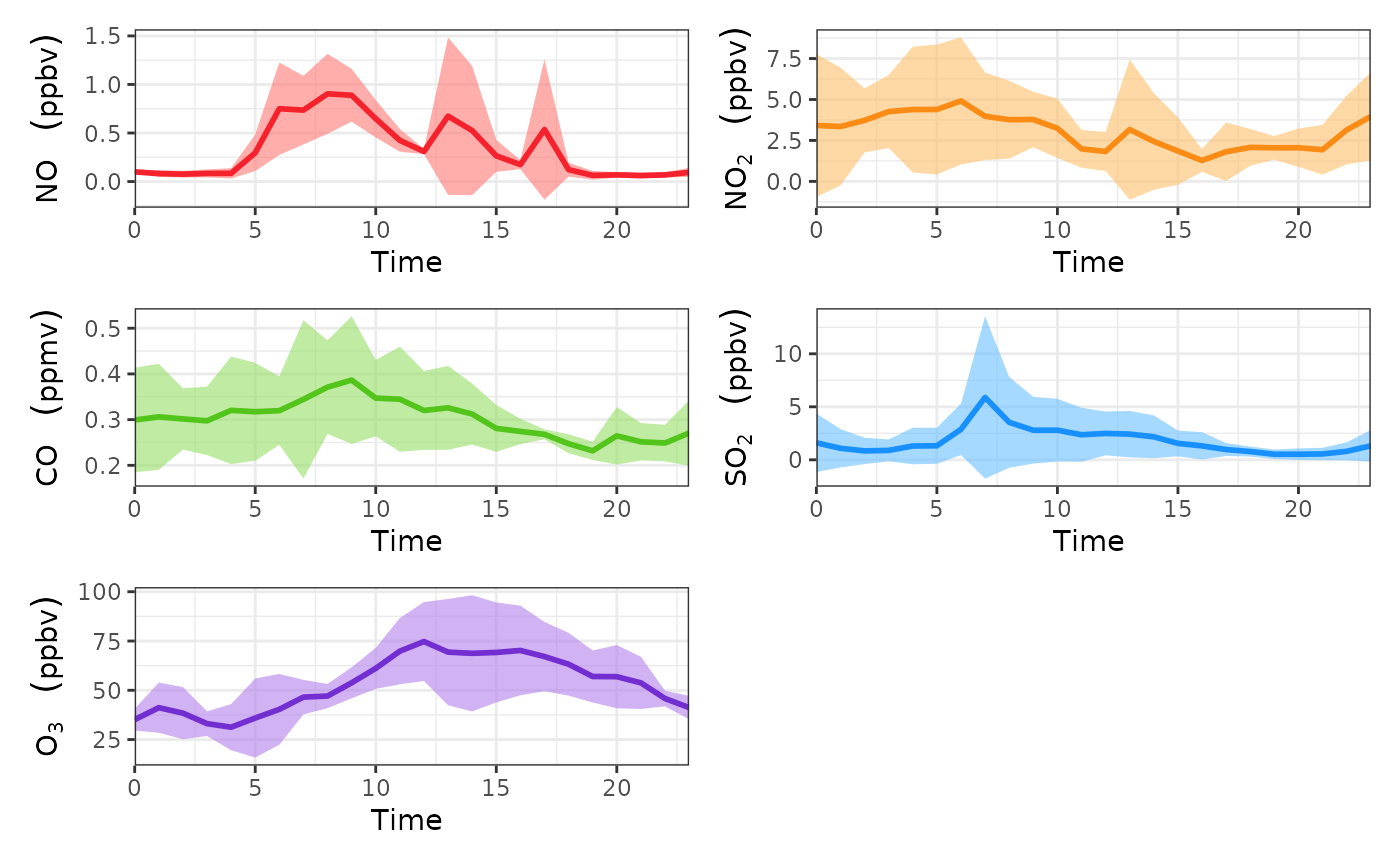
 #example 2
x=avri(aqi, bkip = "1 hour", mode = "recipes", value
= "day", st = "2017-05-01 00:00:00")
#> Joining, by = "temp_datetime"
lcc=c("#f5222d","#fa8c16","#52c41a","#1890ff","#722ed1")
rff=c("#ff7875","#ffc069","#95de64","#69c0ff","#b37feb")
xlab1=list(bquote(Time~""),bquote(Time~""),bquote(Time~""),
bquote(Time~""),bquote(Time~""))
ylab1=list(bquote(NO~" "~(ppbv)), bquote(NO[2]~" "~(ppbv)),
bquote(CO~" "~(ppmv)), bquote(SO[2]~" "~(ppbv)), bquote(O[3]~" "~(ppbv)))
geom_avri_batch(x, alpha=0.6, xlab=xlab1, ylab=ylab1,
lcc=lcc, rff=rff, bquote=TRUE)
#example 2
x=avri(aqi, bkip = "1 hour", mode = "recipes", value
= "day", st = "2017-05-01 00:00:00")
#> Joining, by = "temp_datetime"
lcc=c("#f5222d","#fa8c16","#52c41a","#1890ff","#722ed1")
rff=c("#ff7875","#ffc069","#95de64","#69c0ff","#b37feb")
xlab1=list(bquote(Time~""),bquote(Time~""),bquote(Time~""),
bquote(Time~""),bquote(Time~""))
ylab1=list(bquote(NO~" "~(ppbv)), bquote(NO[2]~" "~(ppbv)),
bquote(CO~" "~(ppmv)), bquote(SO[2]~" "~(ppbv)), bquote(O[3]~" "~(ppbv)))
geom_avri_batch(x, alpha=0.6, xlab=xlab1, ylab=ylab1,
lcc=lcc, rff=rff, bquote=TRUE)
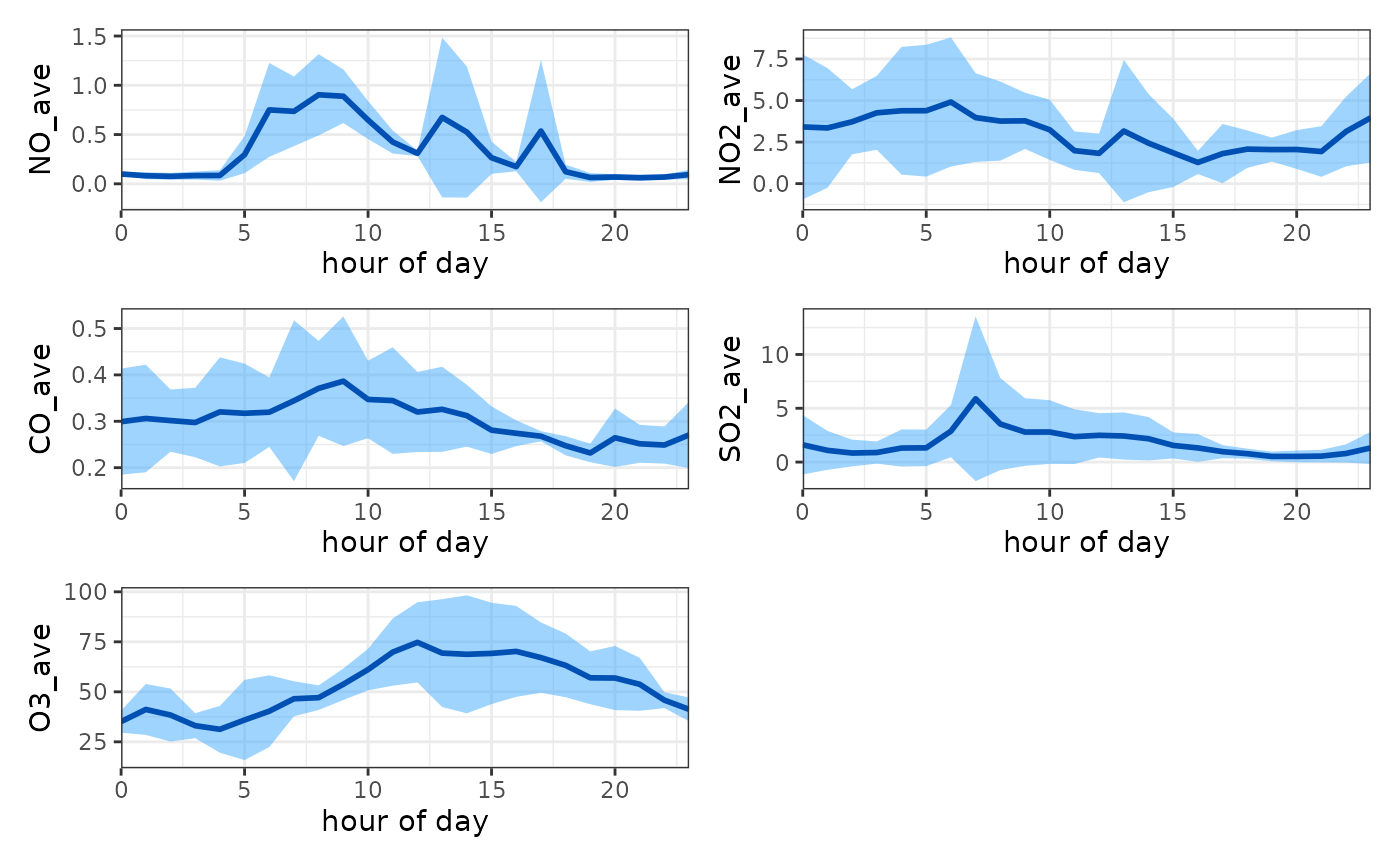
 #example 3
x=avri(aqi, bkip = "1 hour", mode = "recipes", value
= "day", st = "2017-05-01 00:00:00")
#> Joining, by = "temp_datetime"
xlab2=rep("Time",5)
ylab2=c("NO","NO2","CO","SO2","O3")
geom_avri_batch(x, alpha=0.6, xlab=xlab2, ylab=ylab2,
lcc=lcc, rff=rff, bquote=FALSE)
#example 3
x=avri(aqi, bkip = "1 hour", mode = "recipes", value
= "day", st = "2017-05-01 00:00:00")
#> Joining, by = "temp_datetime"
xlab2=rep("Time",5)
ylab2=c("NO","NO2","CO","SO2","O3")
geom_avri_batch(x, alpha=0.6, xlab=xlab2, ylab=ylab2,
lcc=lcc, rff=rff, bquote=FALSE)